import matplotlib.pyplot as plt
import numpy as np
plt.style.use("ggplot")

x = np.linspace(-np.pi, np.pi, 100)
y = np.sin(x)

plt.plot(x, y, label=r"$\sin(x)$")
plt.xlabel(r"$x$")
plt.ylabel(r"$\sin(x)$")
plt.legend()
plt.show()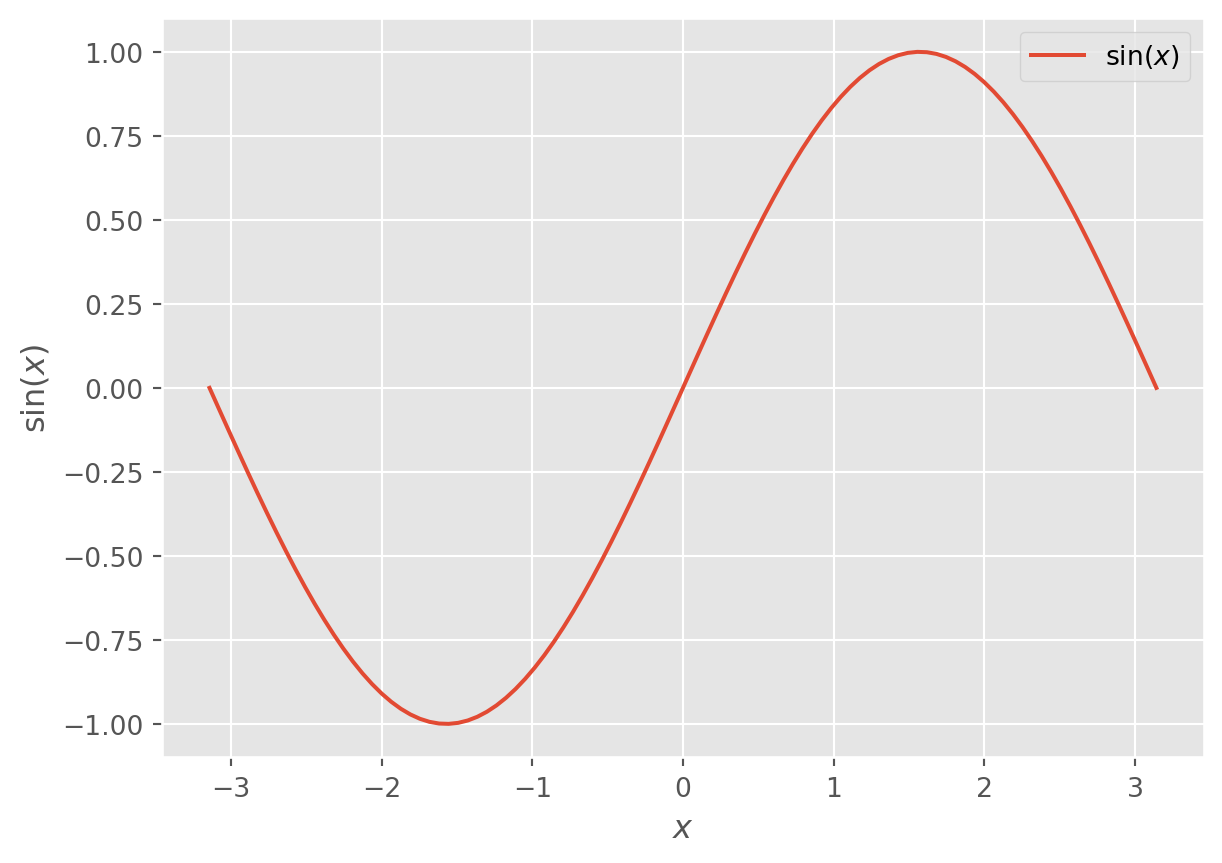
import matplotlib.pyplot as plt
import numpy as np
plt.style.use("ggplot")
x = np.linspace(-np.pi, np.pi, 100)
y = np.sin(x)
plt.plot(x, y, label=r"$\sin(x)$")
plt.xlabel(r"$x$")
plt.ylabel(r"$\sin(x)$")
plt.legend()
plt.show()